
7 Best Seawater Membranes for Desalination in 2026
Choosing a seawater membrane is not simply a search for the highest salt rejection figure. A plant also needs steady output, manageable pressure, and membranes that tolerate feedwater changes. Warm water, suspended particles, and scaling can all affect performance. Small details matter.
Professor Menachem Elimelech, a leading researcher in water treatment, has emphasized a principle reflected in his published work: desalination should be judged by energy demand and environmental impact, not water production alone. This is a paraphrase, not a direct quotation. It offers a useful lens for comparing the seven options in this guide. A membrane that looks efficient on a clean-water test may behave differently when seawater temperature shifts or pretreatment falls short.
The 7 Best Seawater Membranes for Desalination in 2026 examines performance alongside operating realities. It considers salt rejection, water recovery, pressure requirements, fouling resistance, and practical service needs. Not just flux. Product specifications are useful, but they cannot replace site-specific testing or independent verification. Results vary with feedwater and system design, so no single membrane is best for every plant. The rankings are a starting point, not a promise. That distinction can be easy to miss.
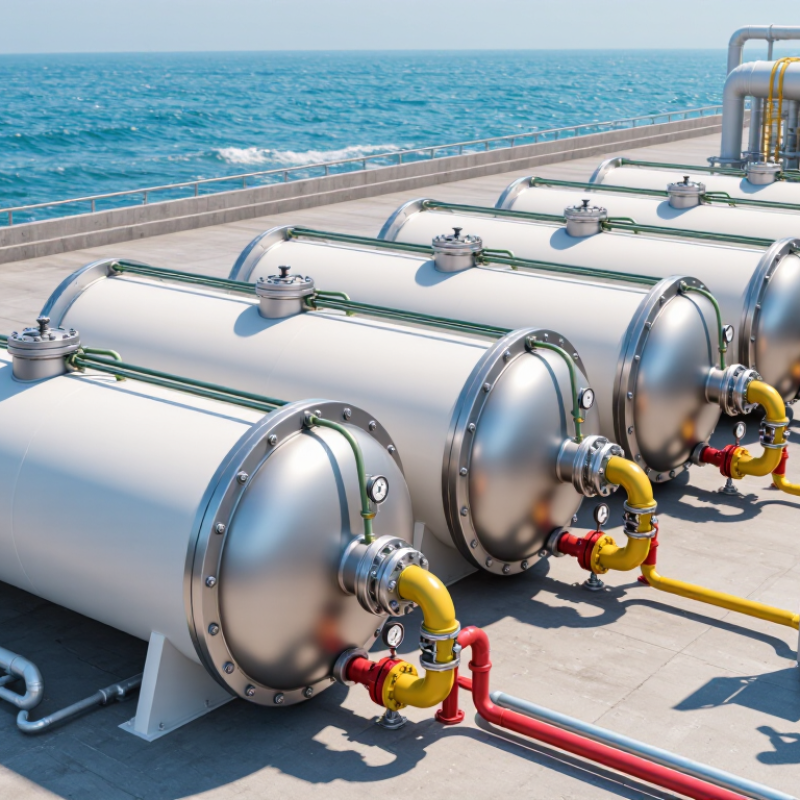
How 35,000 mg/L Seawater Salinity Shapes Membrane Selection
At 35,000 mg/L, seawater makes membrane selection a pressure decision, not a catalog exercise. Dissolved salts resist water movement, so seawater reverse osmosis needs suitable membrane elements and a carefully sized high-pressure pump. Strong salt rejection can protect product-water quality, but lower permeability may reduce output or increase energy demand. Pressure rises. Temperature, recovery rate, and feed chemistry also shift performance.
Compare salt rejection and permeate flow under similar test conditions, rather than relying on headline figures alone. High-rejection membranes may suit tighter water-quality targets, while higher-permeability options can favor output and energy use. Neither is automatically best. Fouling-resistant surfaces can help when organics or fine particles reach the array, but pretreatment still matters. Even a capable membrane cannot make up for poor filtration or neglected cleaning.
Check operating pressure limits, salt passage, boron performance, and cleaning conditions against actual plant data. Boron rejection varies with pH and system design, so one element may not meet every water-quality target without further treatment. Treat projections cautiously: a clean test sheet cannot fully reproduce seasonal temperature changes, scaling risk, or membrane aging. A pilot using the actual feed can expose costly surprises.
7 Best Seawater Membranes for Desalination in 2026 - How 35,000 mg/L Seawater Salinity Shapes Membrane Selection
The comparison below covers membrane options and selection profiles used in seawater reverse osmosis (SWRO). Pressure and salt-rejection figures are indicative industry ranges, not guaranteed product specifications; actual performance depends on temperature, recovery, feed composition, element design, and operating conditions.
| Membrane option | Typical membrane construction | Indicative operating pressure* | Typical NaCl rejection* | Where it fits best | Main selection consideration |
|---|---|---|---|---|---|
| Standard high-rejection SWRO | Aromatic polyamide thin-film composite (TFC), commonly supplied as a spiral-wound element | About 55–70 bar | About 99.6–99.8% | General-purpose desalination of typical open-ocean seawater near 35,000 mg/L TDS | A widely used balance of salt rejection, operating pressure, and availability; requires effective pretreatment. |
| Low-energy SWRO | Low-pressure polyamide TFC membrane design | About 50–65 bar | About 99.4–99.7% | Projects prioritizing lower pressure and energy use where the permeate quality target can be met | Confirm salt passage and product-water requirements at the planned recovery and feed temperature. |
| Very-high-rejection SWRO | High-rejection polyamide TFC membrane design | About 60–80 bar | About 99.7–99.8% | Applications requiring very low salt passage or reduced load on downstream polishing | Higher rejection may require more pressure; verify net energy use and design permeate quality. |
| Fouling-resistant SWRO | Surface-modified or hydrophilic polyamide TFC membrane | About 55–70 bar | About 99.4–99.7% | Feeds with elevated organic or biological fouling risk, when paired with appropriate pretreatment | A fouling-resistant surface can help manage fouling but does not replace sound intake treatment, cleaning, or monitoring. |
| High-productivity SWRO | High-permeability polyamide TFC membrane design | About 55–70 bar | About 99.4–99.7% | Installations seeking more permeate per membrane area or a smaller membrane footprint | Higher flux can increase concentration polarization and fouling risk if recovery, crossflow, and pretreatment are not well managed. |
| Cellulose triacetate (CTA) SWRO | Cellulose-based asymmetric membrane, commonly configured as a hollow-fiber element | About 55–75 bar | About 99.4–99.7% | Specialized systems where chlorine tolerance is useful and operating conditions suit the membrane | Compared with polyamide TFC, CTA generally has a narrower suitable pH and temperature range; check element-specific limits. |
| Boron-focused SWRO selection | A high-rejection polyamide TFC membrane selected for boron performance, often used with a second pass or pH adjustment | About 60–80 bar for the first pass; system-dependent thereafter | About 99.6–99.8% for NaCl; this does not indicate boron rejection | Projects with a defined low-boron product-water target, such as some irrigation or potable-water applications | Boron passage differs from salt passage; assess boron separately using feed pH, temperature, recovery, and the full process design. |
*Indicative ranges for seawater reverse osmosis, not guaranteed operating or performance values. Actual pressure and rejection should be established with element-specific data and a projection based on the site’s feed analysis, seawater temperature, recovery, and product-water specification. Aromatic polyamide membranes are generally sensitive to free chlorine and require suitable dechlorination.