
How to Calculate Carbon Fiber Production Line Cost
Estimating Carbon fiber production line cost requires more than adding equipment prices. A reliable estimate connects production capacity, process design, site conditions, and operating requirements. A small pilot line may need precursor preparation, spinning, stabilization ovens, carbonization furnaces, surface treatment, drying, and winding equipment. Each section affects the next.
Details matter.
For example, a furnace sized for 1,000 tonnes annually may require different utilities than a pilot system. Electricity, natural gas, cooling water, ventilation, and exhaust treatment can significantly change the budget. Installation, factory modifications, quality-control instruments, spare parts, and operator training also deserve separate allowances. Experienced manufacturers usually request material specifications, target tow size, production yield, energy data, and local construction conditions before preparing a quotation.
Vendor quotations are useful, but they are not complete project budgets. Freight, commissioning, import duties, infrastructure, and process validation may be excluded. Costs can also rise when the line requires customized automation or higher temperature control. This is where early estimates often become too optimistic. They may overlook maintenance access, fire protection, or the time needed to stabilize product quality.
This guide explains how to build a practical Carbon fiber production line cost model. It compares capital expenses with recurring operating costs and highlights the assumptions behind each figure. Readers can use the framework to question supplier proposals, identify hidden expenses, and create a more defensible investment plan. Exact results still depend on technology, location, capacity, and commercial agreements. Estimates should be reviewed by qualified process, financial, and safety professionals before any purchasing decision.
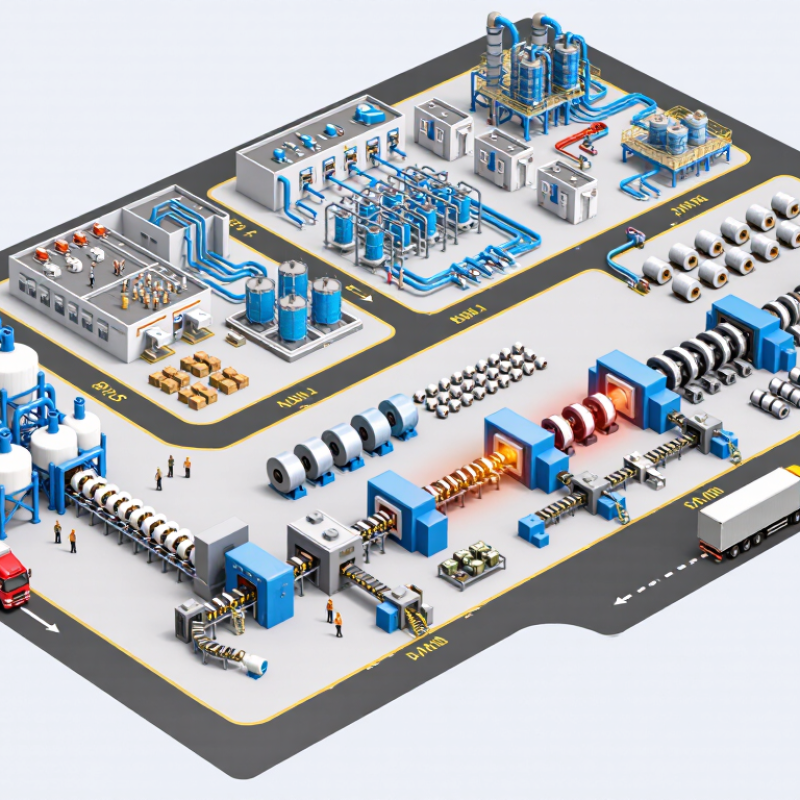
Defining the Scope and Output of a Carbon Fiber Production Line
Calculating carbon fiber production line cost begins with a clear definition of scope. A small pilot line and an automotive-scale plant cannot share the same budget assumptions. In project reviews, I record the target fiber type, annual tonnage, precursor, and operating schedule. These choices shape nearly every major cost.
Output must be described in physical terms, not vague phrases such as “high capacity.” State kilograms per hour, operating days, utilization, and expected yield. For example, a line rated at 100 kilograms per hour may produce far less than 800 tonnes yearly after maintenance, changeovers, and quality losses. Include tow size, filament count, tensile requirements, and allowable variation. These details determine spinning, stabilization, carbonization, surface treatment, winding, testing, and emissions-control capacity. They also affect utilities, labor, floor space, and safety systems. Small omissions become expensive.
A reliable estimate separates equipment, installation, civil work, utilities, commissioning, training, and contingency. Ask suppliers for clear boundary limits. Does the quotation include ovens, gas systems, wastewater handling, laboratory instruments, and spare parts? I have seen early estimates fail because “production line” excluded buildings and high-voltage upgrades. That mistake is easy to make. Recheck the mass balance against realistic yield data, then test optimistic and conservative output cases. A lower initial throughput may be wiser when demand, feedstock quality, or process stability remains uncertain.
How to Calculate Carbon Fiber Production Line Cost - Defining the Scope and Output of a Carbon Fiber Production Line
Indicative planning benchmarks for a PAN-based carbon fiber line. Values are shown in 2025 U.S. dollars and represent a complete carbonization-to-winding facility, excluding PAN precursor manufacturing, land acquisition, financing, taxes, and contingency.
| Cost and Scope Dimension | Pilot Line | Small Commercial Line | Medium Commercial Line | Large Commercial Line |
|---|---|---|---|---|
| 1. Production Definition and Output | ||||
| Annual finished carbon fiber output | 0.1–0.5 kilotonnes/year | 0.5–1.5 kilotonnes/year | 2–5 kilotonnes/year | 5–10 kilotonnes/year |
| Typical operating schedule | 5–6 days/week; campaign production | 6 days/week; 7,000–8,000 operating hours/year | Continuous operation; 8,000–8,400 operating hours/year | Continuous operation; 8,000–8,400 operating hours/year |
| Typical product form | Research-grade continuous filament tow | Industrial-grade continuous filament tow | Industrial-grade tow for composite applications | High-volume industrial-grade tow |
| Typical tow size | 1K–12K filaments | 12K–24K filaments | 24K–50K filaments | 24K–50K filaments |
| Approximate PAN precursor demand | 0.20–1.00 kt/year | 1.00–3.00 kt/year | 4.00–10.00 kt/year | 10.00–20.00 kt/year |
| 2. Process Scope Included in the Estimate | ||||
| PAN tow pay-off and tension control | Included | Included | Included | Included |
| Stabilization or oxidation ovens | 1 process train | 1 process train | 1–2 process trains | 2–4 process trains |
| Low-temperature carbonization | Included | Included | Included | Included |
| High-temperature carbonization | Optional or limited capacity | Included | Included | Included |
| Surface treatment and electrochemical oxidation | Included | Included | Included | Included |
| Washing, drying, and sizing application | Included | Included | Included | Included |
| Winding, packaging, and finished-goods handling | Included | Included | Included | Included |
| Process-control system and data acquisition | Basic monitoring and manual intervention | Distributed control with recipe management | Integrated distributed control system | Redundant integrated control system |
| Quality-control laboratory | Basic tensile, density, and sizing tests | Routine mechanical and chemical testing | Full production and failure-analysis laboratory | Full laboratory with production-development capability |
| 3. Indicative Capital Cost by Category (USD million) | ||||
| Core process equipment | $3.0–6.0M | $7.0–14.0M | $18.0–35.0M | $35.0–70.0M |
| Thermal systems, furnaces, and exhaust treatment | $1.5–3.0M | $4.0–8.0M | $10.0–20.0M | $20.0–40.0M |
| Utilities and environmental systems | $1.0–2.0M | $2.5–5.0M | $6.0–12.0M | $12.0–25.0M |
| Building fit-out, clean areas, and material handling | $1.0–2.5M | $3.0–6.0M | $7.0–15.0M | $15.0–30.0M |
| Engineering, installation, commissioning, and training | $2.0–4.0M | $5.0–10.0M | $12.0–25.0M | $25.0–50.0M |
| Estimated installed capital cost | $8.5–17.5M | $21.5–43.0M | $53.0–107.0M | $107.0–215.0M |
| 4. Utility and Operating Planning Parameters | ||||
| Electricity demand for the process line | 1.5–3.0 GWh/year | 5–12 GWh/year | 18–40 GWh/year | 40–85 GWh/year |
| Natural gas or equivalent thermal energy | 3–8 GWh/year | 12–30 GWh/year | 45–100 GWh/year | 100–220 GWh/year |
| Process and cooling water | 5–20 m³/day | 20–60 m³/day | 60–180 m³/day | 150–400 m³/day |
| Compressed air and inert-gas systems | Small packaged systems | Centralized plant systems | Centralized systems with standby capacity | Redundant centralized systems |
| Direct production labor | 15–30 employees | 30–60 employees | 60–120 employees | 120–220 employees |
| 5. Cost Drivers Used to Refine the Budget | ||||
| Product performance target | Development and repeatability | Standard industrial performance | Tighter strength, modulus, and sizing tolerances | High consistency across multiple production trains |
| Line redundancy | Low; single-point downtime is acceptable | Limited spare capacity | Partial redundancy for critical utilities | Redundant utilities and parallel process trains |
| Expected commissioning period | 12–18 months | 18–24 months | 24–36 months | 30–48 months |
| Recommended contingency allowance | 15–25% of installed cost | 15–20% of installed cost | 10–20% of installed cost | 10–15% of installed cost |
| Excluded cost items | PAN precursor plant, land, financing, taxes, import duties, long-term inventory, customer qualification costs, and major off-site infrastructure. | |||
| Planning note: The installed capital cost should be calculated as core equipment plus utilities, buildings, engineering, installation, commissioning, and contingency. Actual costs vary materially with output specification, energy prices, local construction rates, environmental requirements, furnace configuration, automation level, and whether the PAN precursor is purchased or produced on site. | ||||